

Products
Database Search Solution (New Version) Search Control SEO Pager Highlighter Shortcut Controls Crypt Package Free ASP.NET Controls
Geotargeting Component ASP.NET Media Player Control Flash Video Player Control Services
ASP.NET Telecommute Jobs Free IP Location Lookup Test .Net Regular Expressions CSS/Table/DIV Page Layouts Custom Programming Article Sites Master List |
ASP.NET Code DebuggingThere are several kinds of mistakes you can make when you coding, no matter how skilled you are. It can be very hard to track down the problem in your code. Fortunately the .NET Framework SDK includes a lightweight debugger that is perfectly suited for this task. Together with Tracing and Exception Handling you're armed and ready. There are several kinds of mistakes you can make. The first group of mistakes is the easiest one to find: syntax errors. These are errors against the syntax of a particular programming language (in this case C#). Visual Studio underlines syntax errors at design time and provides a tooltip with some extra explanation. If you happen to miss out an error and try to compile, you'll get an Error List (or View > Error List) with all the errors in it. Double clicking an error will bring you to the line that has to be corrected. The second group of mistakes is logic errors. Logic errors will not cause the program to stop working, but it can produce incorrect data that may not be immediately recognizable. The mistake could be a logical error in a statement, algorithm or even selecting the wrong method. To debug these type of errors you'll have to output the program's variables to a file or on the screen. It might even be necessary to place breakpoints and run through the code line by line. The last group of mistakes is runtime errors. Runtime errors will cause the program to stop working. Some of these errors will have to be repaired (e.g. null pointers) and others should be cought with Exception Handling (e.g. parse error in a string when you want an integer). Debug configurationTo enable debugging you'll have to add following line between the configuration tags in your Web.config file: If you didn't add the line to your Web.config file yet, Visual Studio will ask to do it for you the first time you hit F5 (or Debug > Start Debugging). Be sure to disable this setting when you put your Web site in production because it can significantly affect application performance. BreakpointsA breakpoint is a line in your code where the execution of the application is temporarily interrupted. Note that the program is interrupted just before that line is executed, not just after. To place a breakpoint click in the Margin Indicator bar next to the line of code or select the code and hit F9 (or Debug > Toggle Breakpoint). When you hit F5 to debug, the application will halt at the breakpoint. It is possible to assign advanced settings to a breakpoint by opening the breakpoints window (Debug > Windows > Breakpoints). You can assign a condition under which the breakpoint is hit when the breakpoint location is reached. If the expression is true or has changed then the application will interrupt, otherwise it will continue. Another possibility is counting the number of breakpoint hits and break at a certain number (or multiple of that number) or each time after a certain amounts of hits has been let through. It's also possible to print a message or run a macro with these advanced breakpoints. Break mode commandosHere's a list of useful commandos available on the toolbar and in the Debug menu while in break mode:
Debugging windowsBreak mode is often used to print and follow values of the variables and expressions. This can be done in several ways, only a few will be explained here. The easiest way is to hover over the variable and it will show the current assigned value and most of the time extra properties (hidden under a + sign). The first real window is the Quick Watch which shows up with Ctrl+Alt+Q (or Debug > Quick Watch). In this window it's possible to quickly check and if needed change the value of a variable. It's also possible to add another variable or calculate an expression. 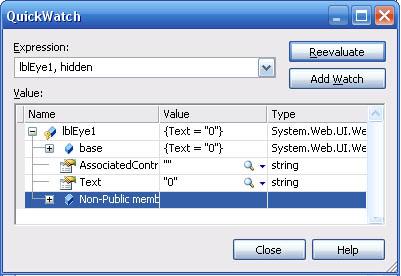 The Autos Window (Ctrl+Alt+V,A or Debug > Windows > Autos) shows the variables in the active statement and the previous code line. The Local Window (Ctrl+Alt+V,L or Debug > Windows > Locals) shows the variables in the current procedure/form. You never know you'll find your mistake while checking the flow of the program. For this purpose you have access to the Call Stack Window (Ctrl+Alt+C or Debug > Call Stack) which follows the flow of the program and shows info on every function call. Every single window has his strengths in certain cases. It's up to you to choose the right window for the right job. 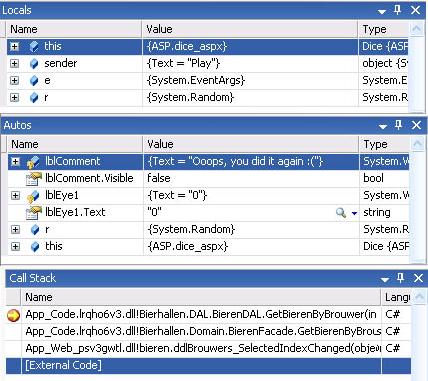 TraceTrace is a performance tool that gives you better sight on how a page works. In the trace log you can find everything that has to do with the current page covering things like execution time, every single control with their hierarchy and viewstate, header collections and server variables. And next to all of this you can add your own comments in the trace log thanks to Trace.Write() and Trace.Warn(). This might be useful to see what happens between two of your own comments. You can activate Trace on page level by adding Trace=true in the page directive or on application level with the following lines in your web.config file: <configuration> In the picture below you can see the source of a button click event where output to the trace log is added at the top and the bottom of the event code. Underneath the source code fragment you have a part of the trace log itself as it is generated after you clicked the button. You notice both entries in the trace log that were created by the code. protected
void btnBereken_Click(object
sender, EventArgs e) 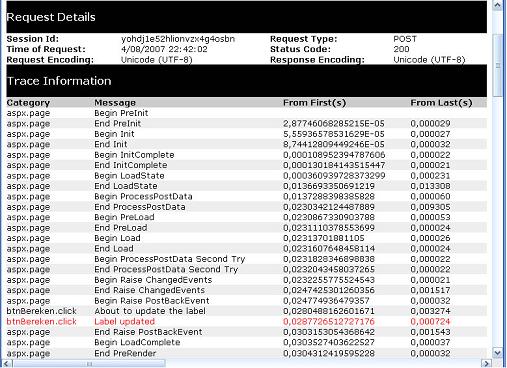 Exception HandlingNo matter what you do, some errors will always have a chance to occur (e.g. error if you want to parse an integer out of a textbox and the user enters a normal string or even an invalid number). The last thing you want is to show those errors to the user so you'll have to handle all the possible exceptions. This can be done on several levels. The first place where you should handle exceptions is where you generate them yourself (by throwing a new exception) or where you know exceptions are very possible to occur (divide by 0, missing database link, ...). This is simply done by adding try/catch/finally around the dangerous code fragments. The finally part is optional and is used in case you want something to happen no matter if there is an exception or not. But be prepared! Some exceptions are totally unexpected or you just forgot one of the possible exceptions while handling the rest. You can catch these on page level by overriding the standard OnError event. After handling the exception and maybe generating some output to a log or the screen you can kill the error and prevent it to go further to application level with Server.ClearError(). protected
void btnBereken_Click(object
sender, EventArgs e) The last level to catch exceptions is the application level. You might choose to drop out the Server.ClearError() on page level to forward the exception to the application level. This can be useful if you want to write the error in a log or event log file and mail the administrator that an unexpected error has occurred. All these possibilities can be implemented in Global.asax (known as the ASP.NET application file).
void Application_Error(object
sender, EventArgs e) Using this method you might consider adding some user-friendly error pages since you don't want them to get stuck in the generated error page. It also looks more professional if you warn the user with a nice message like "There has been an unexpected error, the administrator has been informed. Please try again later." You can create this error page yourself and by adding some extra code to your Web.config file your site can crash with style. <customErrors
mode="On"
defaultRedirect="~/Error.aspx">
You can download Sample Debugging Example Application used in this tutorial This tutorial is written by Assesino Tutorial toolbar: Tell A Friend | Add to favorites | Feedback | |