

Products
Database Search Solution (New Version) Search Control SEO Pager Highlighter Shortcut Controls Crypt Package Free ASP.NET Controls
Geotargeting Component ASP.NET Media Player Control Flash Video Player Control Services
ASP.NET Telecommute Jobs Free IP Location Lookup Test .Net Regular Expressions CSS/Table/DIV Page Layouts Custom Programming Article Sites Master List |
Make Charts in ASP.NET 2.0IntroductionGraphs and charts are important tools for the analysis of data. In this tutorial, we will look at how to represent data in terms of a bar chart and pie chart. To make this possible, the latest rendition of Microsoft's Graphics Device Interface (GDI+) was brought on the market. Scenarios to draw bar and pie chartsIn our bar and pie chart example, we will represent the data of a fictitious country having 4 towns; namely: Town A, Town B, Town C and Town D. Their population will be modeled in terms of graphs and charts. The figures are given below:
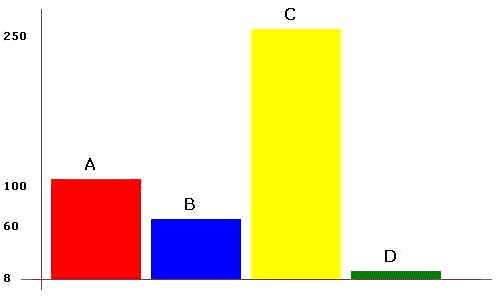 Bar chart that should be outputted 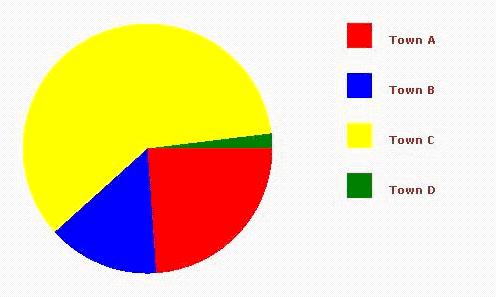 Pie chart that should be outputted Useful classesBelow are some of the useful classes that will be used to achieve what we want: As any drawing surface has a width and a height, so does the Bitmap object. So, when we will create a Bitmap object, we will pass in a width and a height as parameters in the constructors. Moreover, we have to specify “Pixel Format Argument” which means whether the pixel format should be 24-bits RGB color, 32-bits RGB color, GDI-colors etc.. In short the following code will do the work. Dim Image As New Bitmap(500, 300, PixelFormat.Format32bppRgb) The Graphics classOnce you have created the Bitmap object, you need to obtain a Graphics object that references that Bitmap object. The following code will do the job.
' Get the graphics context for the bitmap.
The x vs. y coordinates system is illustrated in the figure below. 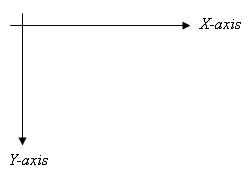 Coordinate axes for the Bitmap object The Fun beginsNow that you have a “surface to drawâ€, as you may have guessed, you will need a pen or brush to draw. To create a pen, a few properties of the pen should be specified; like the color of the pen and the width of the pen...
' Create a pen for drawing Useful methods for drawingNow that we have a set of drawing tools at our disposal, the graphics class also has a set of interesting methods to simplify our work for drawing objects like: circles, rectangles, text and the list goes on.
N.B. the above methods may be overloaded, so we used the names only. It is left to you as an option to explore how the overloaded methods differ. Some concerns needed to draw bar charts and pie charts
Coding the Chart Generator functionsFirst of all create 2 buttons and label them “Barchart†and “Piechart†as shown in the figure below: 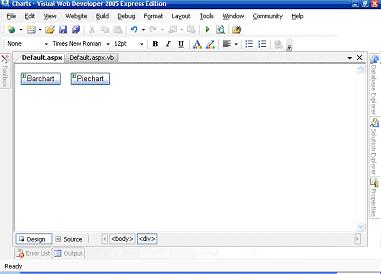 Next, we shall declare some variables for the Bitmap object, Graphics object, population values, town names and the color representing each town. The code is as follows:
' Variables declaration Next, in our Page_Load event, we will call a function that will create objects from the Bitmap and Graphics classes. We should also create the brushes that will be used for drawing the charts. The code snippet below does the job:
' Create an in-memory bitmap where you will draw the image.
myBrushes(3) = New SolidBrush(Color.Green) The bar charts have to be placed in a manner that we could draw the axes and label them as well. So, we declare an interval variable that will space the bar charts.
' Variables declaration The above code has only to be linked with the Click event of the “Barchart†button that was placed ok the page before. We have to keep track of the total angle so far and add the current angle produced by population[i] and use the FillPie method to draw the piechart. Next, to draw the pie chart, we make use of the following code:
' Variables declaration The above code has to be linked with the “Piechart†button’s Click event. It is important to place all your codes in Try..Catch block as a good programming practice. Now that we have the methods required to draw the charts, we should now output them on the browser. The piece of code below simply outputs the chart:
' Render the image to the HTML output stream. Remember that myImage is the Bitmap object that we created earlier. Et voila! Now, you can play around with the set of methods to produce other drawings or to improve the classes. You can also explore the rich set of methods and classes that the .NET framework provides us for producing drawings. Note that every new feature will take time. If your projects requirements demands a lot of working hours, you can consider some more professional solution, like ChartingControl.NET. This control will give you different chart types including 3D charts. However, every GDI+ solution will return you a static chart image. If you want to REALLY impress your clients or users you must have Rich Chart Server for .NET. On server side you work with ASP.NET control like with every other control, but it produces beautiful and interactive Flash charts on client side. It provides animations, links, interaction with clients and even audio narration. Check examples on chart gallery to see what I am talking about, it is simply amazing! Also, you can try other custom ASP.NET Chart Controls to find which is best choice for your specific case. Tutorial toolbar: Tell A Friend | Add to favorites | Feedback | |