

Products
Database Search Solution (New Version) Search Control SEO Pager Highlighter Shortcut Controls Crypt Package Free ASP.NET Controls
Geotargeting Component ASP.NET Media Player Control Flash Video Player Control Services
ASP.NET Telecommute Jobs Free IP Location Lookup Test .Net Regular Expressions CSS/Table/DIV Page Layouts Custom Programming Article Sites Master List |
Data Visualization Using ASP.NET 2.0Data Visualization Problem OverviewData Visualization is of immense importance these days. In this tutorial we will graphically visualize a data set (iris) uploaded by user. Iris data set can be downloaded as a part of Data Visualization sample project, used in this tutorial We will build an ASP.NET application that will allow a user to upload iris data file on the server. Server will then read the file and calculate its summary. Summary will include average, minimum, maximum, and Pearson's correlation etc. Using the ASP.NET drawing libraries the application will draw the correlation matrix as a bipartite graph and adjacency matrix form (using some pixel oriented technique). At the end we will compare both the diagrams. Solving the ProblemFirst of all you must have Visual Studio .NET 2005 all the preliminaries like IIS (Internet Information Service) installed on your computer. To make it simple we will divide our problem in five phases:
Designing a simple GUIIn ASP.NET designing GUI is a breeze. First of all open Visual Studio, go to the File menu, select New > Web Site. A dialogue will open. You have to specify file name, location and language. In the template section select ASP.NET website, give any name and path but select C# as language. 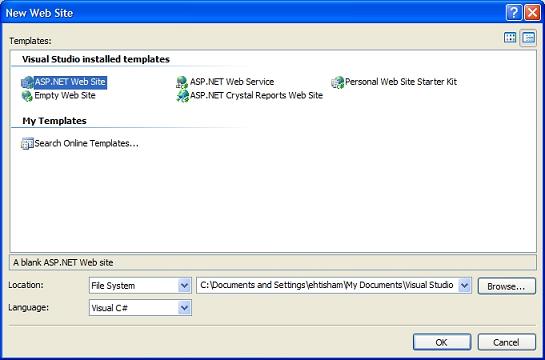 In your Default.aspx file you will see the toolbox tab on left side. The toolbox tab will expand as you point mouse over it. If you don't see the toolbox you can make it visible by going to View menu and then selecting Toolbox. Dot NET has various controls in their appropriate categories. Here is how a DOT NET tool box looks like: 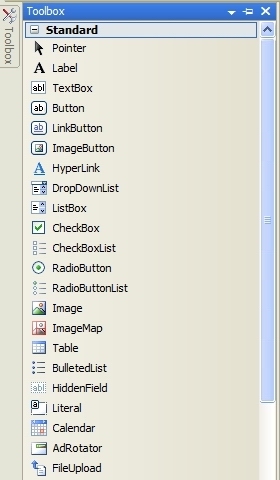 Now one by one drag the following controls from toolbox and place them in your Default.aspx file:
You can place all these controls inside another control, like the Panel control. In this way you can manage them with ease. You can also name controls for convenience, just click the control and press F4 and see its properties. Here is how the application should look right now: 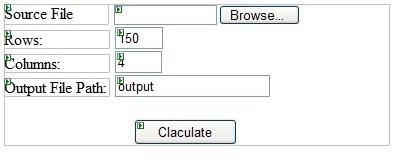 In ASP.NET when you double click a control its default event handling function is automatically created and displayed on screen. To read our data file, double click the File Upload control we added. In its handler function write the following code:
StreamReader
sr = new StreamReader(FileUpload.PostedFile.InputStream); sr.Close(); In ASP .NET file I/O has been made really easy. You just have to include the name space System.IO. You have to create an instance of the StreamReader class. StreamReader sr = new StreamReader("File Name Here"); After creating the object you can use sr object to read from a file. A white space is used as a delimiter here, but you can also use any other character as well. Split function splits a string and converts it into an array of character on basis of the delimiter. tokens = line.Split(delimeters); Suppose we have the line string: line = "5.1 3.5 1.4 0.2 1" After using the split function following array will be returned: tokens [] = { "5.1", "3.5", "1.4", "0.2", "1"} In C# a 2D array is declared as:
public
double[,] matrix; In this case rows and columns will be replaced by a constant value at runtime, as specified by user. Doing the calculationNow coming to the mathematics part, ASP .NET makes it fairly easy to perform calculations. Here is the code for calculating average, minimum and maximum:
for
(int i = 0; i < columns; i++) Variables averages, minArray and maxArray are one dimensional arrays. Each location of array represents one column's result. For example average for column 0 for the data matrix will be stored in averages[0], similarly colum 3's average will be at averages[3]. There are 5 columns in iris dataset. Fifth column is the class name which is not important and we will ignore it in our calculations. After doing these calculations we need to display the results. ASP.NET provides great controls for displaying data. We will use the table control for this purpose. From the toolbox place the Table control in your Default.aspx file. Write the following code after the average, maximum and minimum calculation code:
int
numrows = 4; Here are the results as displayed in the table: 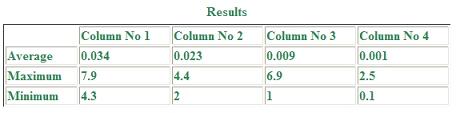 As you might have guessed TableRow represents row of the table and TableCell is the individual cell. LiteralControl is an ASP.NET class. It basically represents elements like string literals that need not to be processed on the server side. They are just displayed without any change. Convert.ToString() is called to for doing double to string conversion. Code for calculating correlation is a little tricky. In calculating correlation we have to compare each row with every other row. We can also compare columns, but we will settle with row-wise correlation as it will generate a better visualization. As there are 150 rows, the resultant matrix will be 150x150. Here is the code
int
i, j; After calculating correlation we have to convert the correlation matrix to binary (either 0 or 1). Binary conversion will be done on basis of distance from the mean value of the row. If a current value is smaller than average for the row, it will be replaced by 0 and 1 otherwise. The code below will perform this task:
// calculate average of each row We can save the new binary valued matrix in a text file for retrieving it later on (in some other .aspx file).
FileStream
fs = File.Create(FileName); UTF8Encoding class is for encoding characters in Unicode format. Drawing with ASP.NETPainting is the most interesting part of this tutorial. ASP.NET comes with extensive set of libraries for drawing on the fly. To draw your image content type of the page should be image/gif. So we will create a new file. Go to File menu select New>File... Select the Web Form option in the template section, Visual C# in the language section and give the file any name with aspx extension. After creating the new file place the image control on the newly created .aspx page. Image control can be found in the Toolbox under the standard category. First of all read the binary matrix from the output text file ("output.txt"). The whole process is like the file reading done previously. Save it in a 2-D integer matrix, as all values are either 1s or 0s. The trick here is to find the output file name in the new form. You have to first place the file name in the session object in the default form. Session["filename"] = FileNameTextBox.Text+".txt"; Use Server.MapPath to find full path of the file. Server.MapPath tries to find the file in current directory that holds our .aspx file. In the new file write following code:
string
str = Convert.ToString( Session["filename"]
); In ASP.NET you have to include System.Drawing namespace to draw something. Although there is a wide array of shapes available, we will only learn three of them in this tutorial (line, rectangle and ellipse). Before drawing shapes you need to create and initialize objects of Bitmap and Graphics classes.
Bitmap
bmp; It's just like getting a blank paper for drawing. Now, to draw you need to have a pen
Pen
p = new Pen(Color.Red);
// you can choose any other color x1, y1 represent starting position and x2, y2 represent ending position of the line. Drawing rectangle and ellipse is similar to drawing a line. Only difference is that you need to specify width and height instead of x2 and y2. graphics.DrawRectangle (p, x, y, width, height); As the name suggests FillEllipse draws a filled ellipse. At the end you also have to specify content type of page, so you will have to write the following two lines:
Response.ContentType = "image/gif"; Here is the problem specific version of code for drawing an adjacency matrix in pixel form.
for
(i = 0; i < size; i++) Given below is the image generated by the code:  Green area represents 1s and black represents 0s. Now we will move towards bipartite graph drawing. Code for this task involves drawing ellipses (nodes or vertices) and lines (edges). I reduced the size of matrix to try to increase its visual content, other wise 300 nodes (150 in each partition) would have been impossible to see on the contemporary screens. Here is the output after reducing to a 15x15 matrix:  Despite of reduction in the number of nodes the graph still contains a large number of edges making it impossible to interpret. The matrix representation contained more information content and was easier to interpret. To make our graph more attractive we have to reduce number of crossings which is a very costly procedure, and it belongs to the NP- Complete category of problems. To solve this we can use greedy algorithms, genetic algorithms or apply simulated annealing. In the default form, place two buttons for viewing matrix and graph. Write the following code inside their click handlers:
// matrix button click handler Same file, MatrixView.aspx, handles both requests on the basis of gtype which is placed in the session. Server.Transfer directs the page to the specified file. Revisiting the GUIYou can use CSS to make your web forms more attractive. You can place your CSS code in your .aspx file (in its source view). Here is final view of the application after setting different font colors and applying CSS 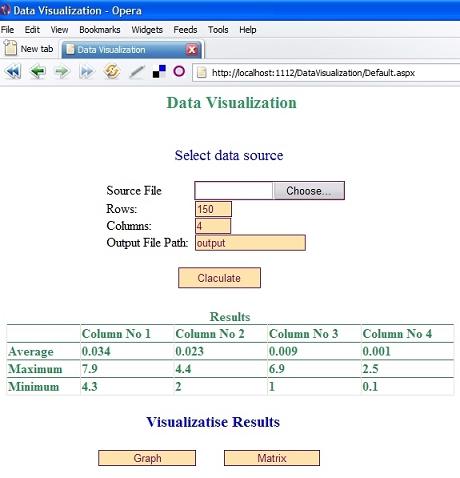 Tutorial toolbar: Tell A Friend | Add to favorites | Feedback | |