

Products
Database Search Solution (New Version) Search Control SEO Pager Highlighter Shortcut Controls Crypt Package Free ASP.NET Controls
Geotargeting Component ASP.NET Media Player Control Flash Video Player Control Services
ASP.NET Telecommute Jobs Free IP Location Lookup Test .Net Regular Expressions CSS/Table/DIV Page Layouts Custom Programming Article Sites Master List |
Debugging with breakpoints in ASP.NETDebugging OverviewApplication code is subject to many types of errors. Examples are syntax errors, and bugs. Most syntax errors can be easily fixed during the compilation phase. On the other hand, most bugs require debugging! Debugging is about running your code line by line to ensure that the execution path and data are both correct. Visual Studio.NET provides you with debugging tools like:
ASP.NET provides you with two classes: 'Debug' and 'Trace'. These are diagnostic classes to help you generate logs during development and debugging. During debugging, you can see how exactly your code is executed by stepping line by line, viewing the values of your variables during each step and showing how these values are changed by each step. You can change the value of a certain variable, You can move the execution point and run application to another point. Visual Studio integrated debugger has many features you can use to debug your applications. These features includes the following: Breakpoints, Stepping, and Data Viewing. In this tutorial we will talk about Visual Studio 2005 integrated debugger's breakpoints feature, and will show you how to use it to debug an ASP.NET web application. Stepping and Data Viewing sample you can see in debugging with "Stepping" and "Data Viewing" features in .NET tutorial. Let's BeginFirst open Visual Studio 2005, and create a new Web Application. In the 'New Web Site' dialog box type the location of your web site and then click ok. In the 'Default.aspx' web page design view, draw a set of controls like those shown in the following figure. 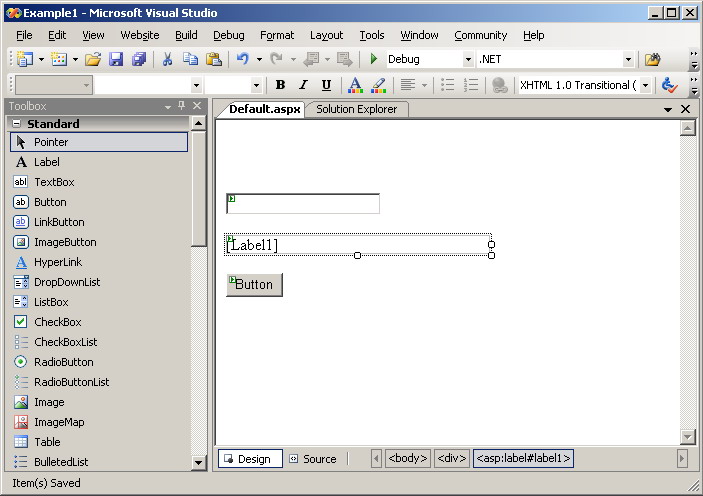 Figure 1 Now, double click the button control to activate the 'Button1_Click' event handler in the 'default.aspx.vb' code file, and then type the following lines of code:
Now, run your application by pressing F5, or choose 'Debug / Start Debugging' from menus. When you run your application for the first time, you will receive the following message. 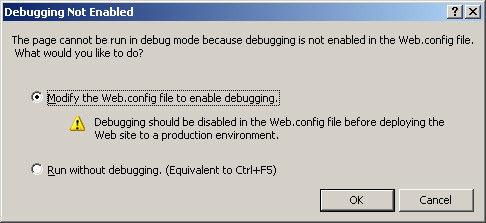 Figure 2 Click 'Ok' to enable debugging. You will see the following page as a result of executing our small application. 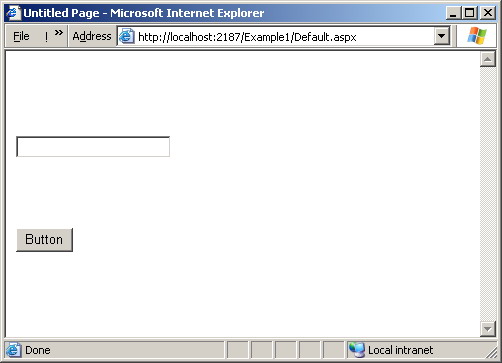 Figure 3 Type a name in the text box, then click the button. You will get the following as a result: 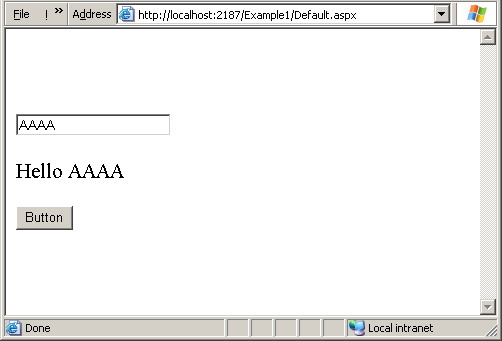 Figure 4 Up to now, every thing is correct and normal. Assume that to one reason or another, you want to stop the execution of your program at a given point or line of code, and want to watch your code and variables behavior. To accomplish this, you need to use breakpoints ... BreakpointsBreakpoints are places in the code, where the debugger will stop the execution of the application. After stopping, you can watch the state of the application's variables, and then you can step through your code. Let's now set a breakpoint at line number 14 ... To set a breakpoint, simply click once at the gray margin next (left) to the line where you want to set the breakpoint. A red circle in the left gray margin, and a red shading over this line of code will appear indicating that, this line is a breakpoint line. See the following figure for more clarity: 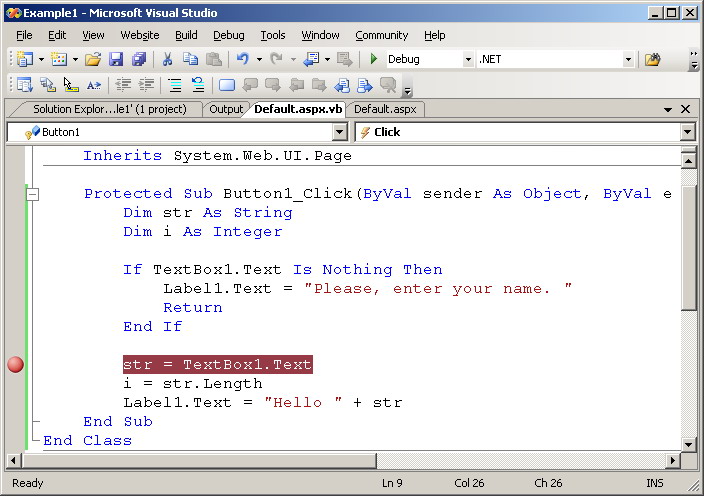 Figure 5 To clear the above breakpoint, just click the red circle again and it will disappear. You can also use F9 or select 'Debug / Toggle Breakpoint' to set a breakpoint or to clear it. In the Break ModeYou can think of a breakpoint as a signal to the debugger. It tells the integrated debugger to pause the execution of your application and puts it at the break mode. While in break mode, your application's data is still in memory, and you still have the ability to resume the execution at any time, but the difference here is that you can control the execution of your code step by step, line by line, watching every piece of code closely looking for violations or bugs. To examine this, let's run our small application while there is a breakpoint at line 14. Type a name in the text box, and then click the button. 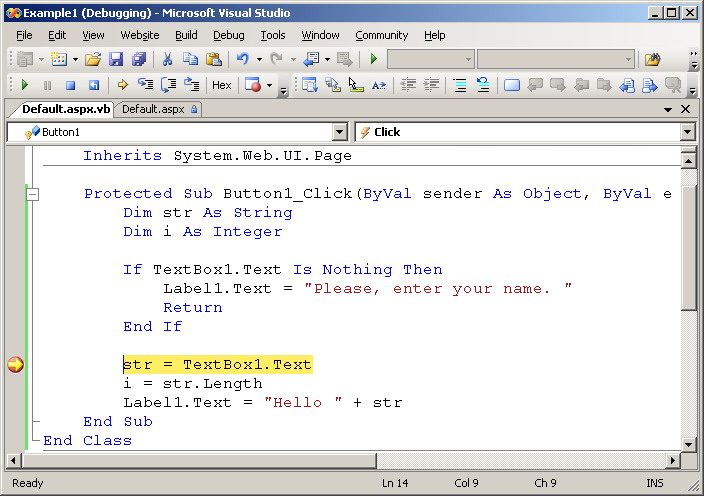 Figure 6 As we mentioned above, our program stopped or let us say suspended its execution process at line 14 - actually before executing line 14 - where the breakpoint is. Viewing Data At this point, you can watch your code state and variables using many data viewing features like: 'Data Tips', 'Visualizers', and 'Variable Windows' like 'Locals' window, 'Autos' window, and the 'Watch' window. You can also edit the value of your variable while you are in the break mode by using some of these data viewers. For more information about data viewers, please check debugging with "Stepping" and "Data Viewing" features in .NET tutorial. Advantages of Breakpoints
Properties of Breakpoints Breakpoints have many magnificent features and properties. Using these features, you can control and modify the behavior of a breakpoint. These properties are: 'Hit Count', 'Condition', 'Action', and 'Filter'. In the next lines, we will talk about the most used two features, 'Hit Count', and 'Condition'. Hit Count The Hit Count property gives you the ability to specify how many you want to hit your breakpoint before breaking the application. You can set a hit counter to stop execution after hitting the breakpoint two times, may be 10 times, or any number you choose. This is very useful when you are dealing with loops. Some times a bug does not appear the first time you execute a loop, access a variable, or call a function. You can set a hit counter by positioning your mouse pointer over a breakpoint line, then clicking the right mouse button and choosing 'Breakpoints / Hit Count' as shown in the following figure. You will need to select a proper selection from the combo box to be able to set the Hit Count. 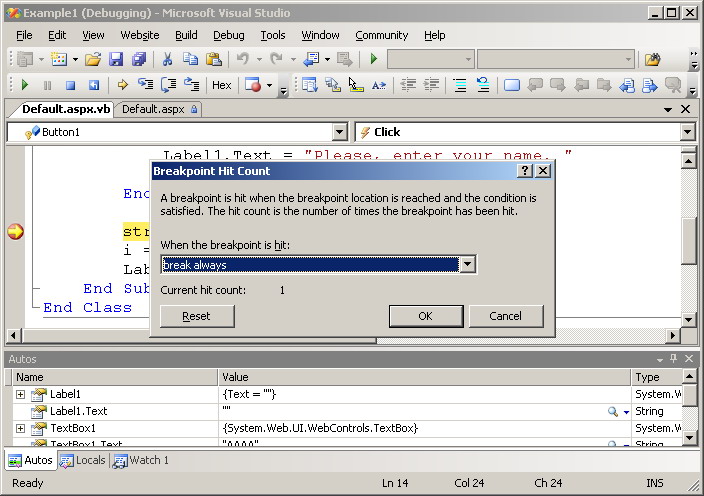 Figure 7 Condition property The Condition property gives you the ability to set a condition, that the debugger will always evaluate. When the condition evaluates to true, the breakpoint will be hit, or otherwise it will be skipped as if it does not exist at all. In our example, stop the debugger by pressing shift + F5 or choosing 'Debug / stop Debugging' from the main menu. Add a new breakpoint at line 16, which is the line shown below.
Position the mouse pointer over the new breakpoint, then right click. Choose 'Breakpoints / Condition'. Add the following condition in the condition text box: 'i>5'. Now delete the breakpoint at line 14 (press F9 there), and run your application. In the text box write '0123' which is only 4 characters length string, and click the button. The debugger will never hit the breakpoint in this case (4 is not >5). Now type '012345' in the text box which is a string of length greater than 5, then click the button. The debugger will now hit the breakpoint. The following figure shows how to set the condition of this breakpoint. 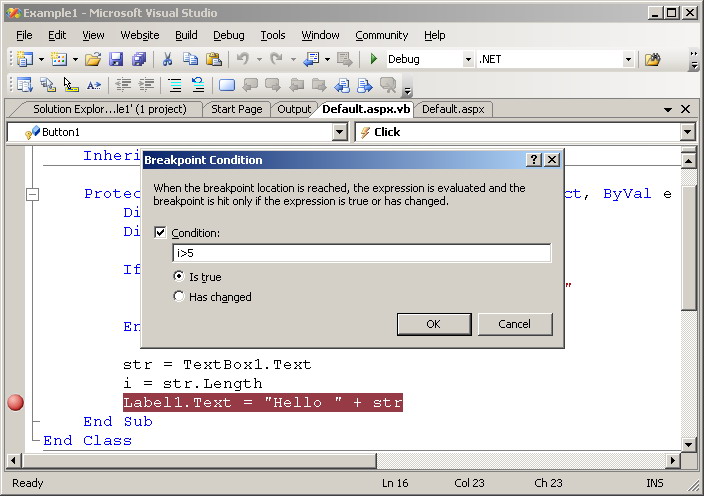 Figure 8 For further information
Tutorial toolbar: Tell A Friend | Add to favorites | Feedback | |