Products
Database Search Solution (New Version) Search Control SEO Pager Highlighter Shortcut Controls Crypt Package Free ASP.NET Controls
Geotargeting Component ASP.NET Media Player Control Flash Video Player Control Services
ASP.NET Telecommute Jobs Free IP Location Lookup Test .Net Regular Expressions CSS/Table/DIV Page Layouts Custom Programming Article Sites Master List |
Tracing in ASP.NET 2.0Tracing is a way to monitor the execution of your ASP.NET application. You can record exception details and program flow in a way that doesn't affect the program's output. In ASP.NET 2.0, there is rich support for tracing. The destination for trace output can be configured with TraceListeners like the EventLogTraceListener. ASP.NET 2.0 Improvements for Tracing
First, we will explore ASP. Net's tracing facilities first, and then learn how to bridge the gap and see some new features in 2.0 that make debugging even easier. Page level TracingASP.NET tracing can be enabled on a page-by-page basis by adding "Trace=true" to the Page directive in any ASP.NET page: <%@ Page Language="C#" Trace="true" TraceMode = "SortByCategory" Inherits = "System.Web.UI.Page" CodeFile="Default.aspx.cs" %> Additionally, you can add the TraceMode attribute that sets SortByCategory or the default, SortByTime. You can use SortByTime to see the methods that take up the most CPU time for your application. You can enable tracing programmatically using the Trace.IsEnabled property. Application TracingYou can enable tracing for the entire application by adding tracing settings in web.config. In below example, pageOutput="false" and requestLimit="20" are used, so trace information is stored for 20 requests, but not displayed on the page because pageOutput attribute is set to false.
<configuration> The page-level settings take precedence over settings in Web.config, so if enabled="false" is set in Web.config but trace="true" is set on the page, tracing occurs. Viewing Trace DataTracing can be viewed for multiple page requests at the application level by requesting a special page called trace.axd. When ASP.NET detects an HTTP request for trace.axd, that request is handled by the TraceHandler rather than by a page. Create a website and a page, and in the Page_Load event, call Trace.Write(). Enable tracing in Web.config as shown below.
<system.web> When you run the page, you can see a great deal of trace information in the browser because we have set PageOutput=true as shown below.
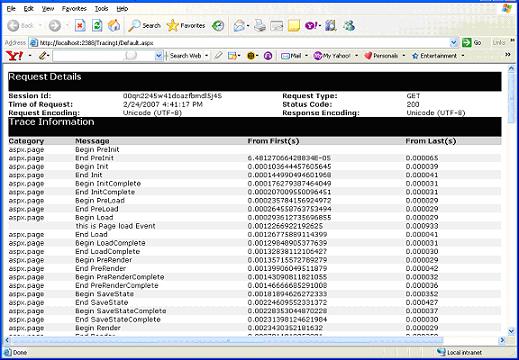
The message from Trace.write appears after Begin Load and before End Load. Eleven different sections in Trace provide a great deal of information. Request Details: This section includes the ASP.NET Session ID, the character encoding of the request and response, and the HTTP conversation's returned status code. TraceInformation: This section includes all the Trace.write methods called during the lifetime of the HTTP request and a great deal of information about timing. The timing information located here is valuable when profiling and searching for methods in your application that take too long to execute.
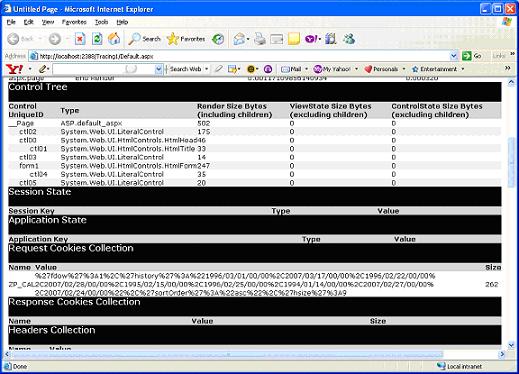
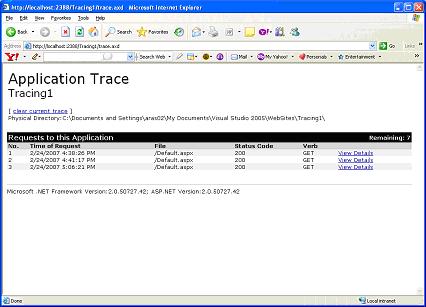
Control Tree: Control tree presents an HTML representation of the ASP.NET Control Tree. Shows each control's ID, run time type, the number of bytes it took to be rendered, and the bytes it requires in View State and Control State. Session State: Lists all the keys for a particular user's session, their types and their values. Application State: Lists all the keys in the current application's Application object and their type and values. Request Cookies: Lists all the cookies passed in during the page is requested. Response Cookies: Lists all the cookies that were passed back during the page's response. Headers Collection: Shows all the headers that might be passed in during the request from the browser, including Accept-Encoding, indicating whether the browser supports the compressed HTTP responses and Accept languages. Form Collection: Displays a complete dump of the Form Collection and all its keys and values. QueryString Collection: Displays a dump of the Querystring collection and all its contained keys and values. Server Variables: A complete dump of name-value pairs of everything that the web server knows about the application. Trace.axd: Page output of tracing shows only the data collected for the current page request. However, if you want to collect detailed information for all the requests then we need to use Trace.axd. We can invoke Trace.axd tool for the application using the following URL http://localhost/application-name/trace.axd. Simply replace page name in URL with Trace.axd. That is, in our case. We should use following URL (Address bar) for our application as shown below.
Trace.axd displays all the tracing information for all requests up to a present limit. Above figure shows that three requests have been made to this application and the right side of the header indicates "Remaining:7" That means that there is seven more requests remaining before tracing stops for this application. After that final request, tracing data is not saved until an application recycle or until you click "Clear Current Trace" from the Trace.axd page. The request limit can be raised in Web.config by setting requestLimit to a higher value as shown below <trace enabled ="true" requestLimit ="20" pageOutput ="true"/> Trace forwardingASP.NET 2.0 introduced new attribute to Web.config <trace> element that allows you to route messages emitted by ASP.NET tracing to System.Diagnostics.Trace:writeToDiagnosticsTrace. <trace enabled ="true" requestLimit ="20" writeToDiagnosticsTrace ="true " pageOutput ="true"/> When you set writeToDiagnosticsTrace to true, all calls to System.Web.UI.Page.Trace.Write(the ASP.NET TraceContent) also go to System.Diagnostics.Trace.Write, enabling you to use all the standard TraceListeners. The simple writeToDiagnosticsTrace setting connects the ASP.NET tracing functionality with the rest of the base class library. New Trace Listeners in ASP.NET 2.0The new ASP.NET 2.0 WebPageTraceListener derives from System.Diagnostics.TraceListener and automatically forwards tracing information from any component calls to System.Diagnostics.Trace.Write. This enables you to write your components using the most generic trace provider and to see its tracing output in the context of your ASP.NET application. The WebPageTraceListener is added to the web.config as shown below.
<system.diagnostics> </system.diagnostics> XmlWriterTraceListenerXmlWriterTraceListener derives from TextWriterTraceListener and writes out a strongly typed XML file. The XML created is not well formed. Specifically, it doesn't have root node. It's just collection of peer nodes. DelimitedListTraceListenerDelimitedListTraceListener derives from TextWriterTraceListener. It writes out comma-separated values (CSV) files. Hence, this article gives brief introduction to new trace features available in ASP.NET 2.0 Happy learning!!!!!!! Tutorial toolbar: Tell A Friend | Add to favorites | Feedback | |